

October 28, 2014
How to train your inbox using Microsoft Azure Machine Learning (part three)

In this three part-series, Theta Software’s product architect and lead consultant Jim Taylor takes a closer look at Microsoft Azure Machine Learning
Azure ML: Making it work, and some thoughts about wider relevance
In this post I’ll go through step by step how to run this experiment, evaluate and publish as a web service, and consider the wider relevance of machine learning.
How to run this experiment
Step 1 – create a machine learning workspace in the Microsoft Azure portal:

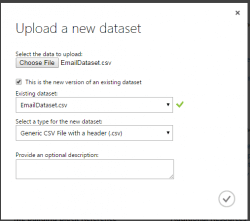
Step 2 – Upload dataset from local file

Step 3 – Create a new experiment using the New > Experiment link
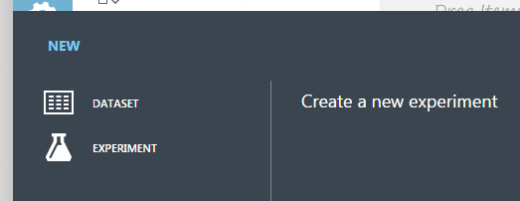
note: you can edit the experiment title on the experiment designer

Step 4 – Drag the dataset onto the experiment designer
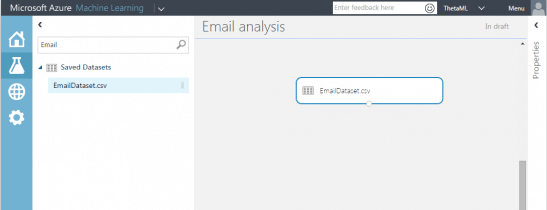
Note that there is a handy “Search experiment options” search.
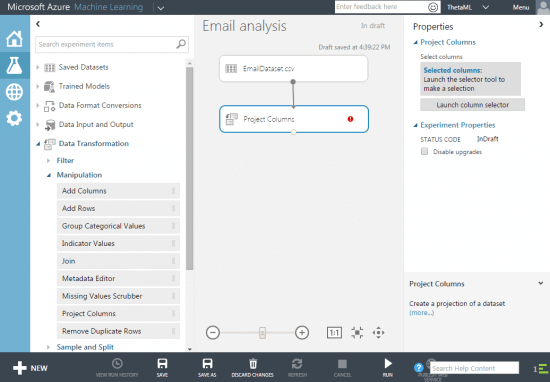
Step 5 – Drag the “Project Columns” module from “Data Transformation > Manipulation”, connect to the dataset and click “Launch column selector” in the properties panel.
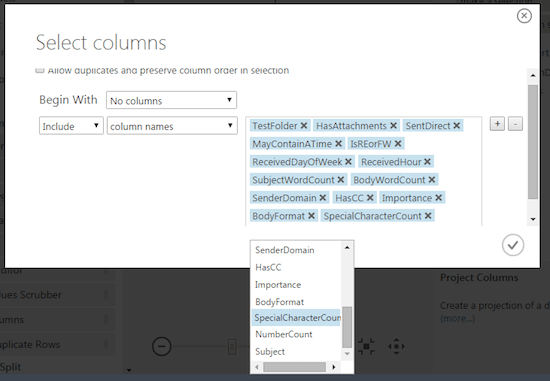
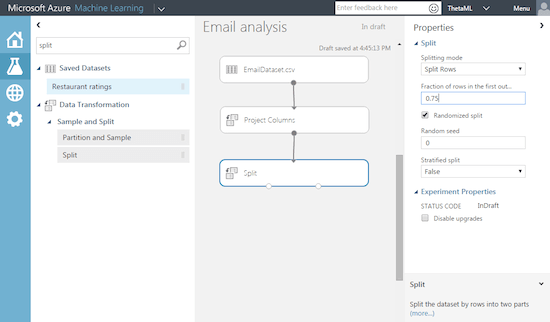
Step 6 – Split the data (75% for training, 25% for testing the model)
Step 7 – Train the model using linear regression

To train the model we need to choose single column to predict – in our case “TestFolder”, a Boolean value indicating the email is in the whereabouts folder.
So we’ll select this in the column selector in the properties pane.

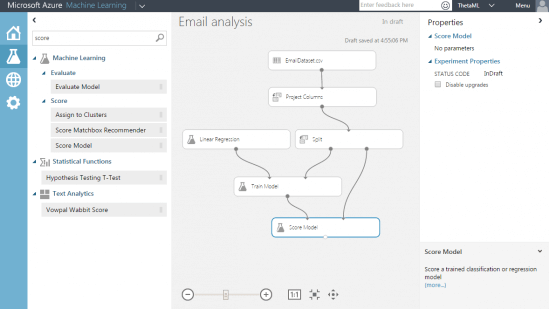
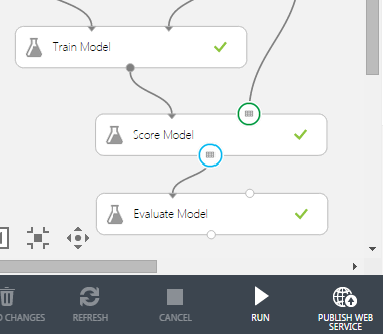
Step 8 – Score the model
Drag the “Score Model” module onto the designer.
Connect the output from train model and split.
In step 6 we split the data – we are now using the 75 % of “trained data” the remaining 25% of data to test and score the model.
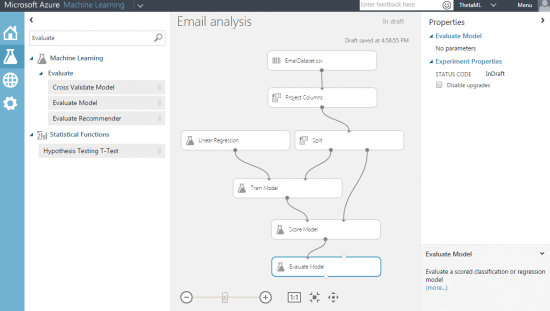
Step 9 – Evaluate the model
To evaluate whether the results of this model are useful we can use the “Evaluate Model” module.
Step 10 – Run the experiment
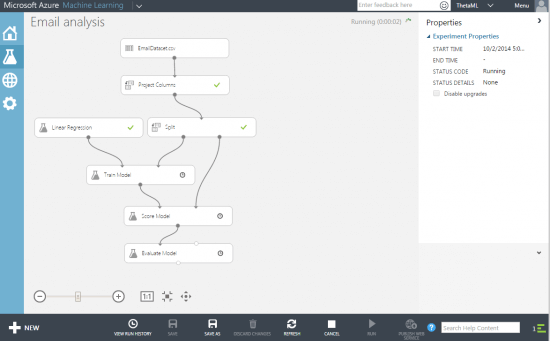
Step 11 – Look at the results of the evaluation
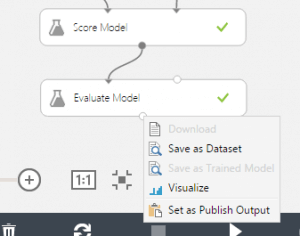
Clicking on the output node of the “Evaluate Model” module presents a context menu including a Visualize option:

One of the key values here is the Coefficient of Determination (CoD) – as the documentation states this is “a statistical metric indicating how well a model fits the data - the closer its value is to one (1.0), the better the predictions.”

At this point you can start to make changes to the dataset to see if adding or removing columns makes a significant difference.
I tried a few changes with the column selection (changes are compared to initial experiment CoD):
- Removing the RecievedDayOfWeek and RecievedHour columns reduces the CoD to 0.793386
- Removing the HasAttachments column reduces the CoD to 0.783959
- Removing the SentDirect column reduces the CoD to 0.74008
- Removing the SenderDomain column reduces the CoD to 0.650235
- Removing the SubjectWordCount and BodyWordCount columns increases the CoD to 0.811054 (this surprised me as I suspected otherwise)
- Removing only the SubjectWordCount column reduces the CoD to 0.796535
- Removing only the BodyWordCount column increases the CoD to 0.810915
- Removing the character count columns (SpecialCharacterCount, NumberCount) reduces the CoD to 0.770703
- Removing only the SpecialCharacterCount column reduces the CoD to 0.770528
- Removing only the NumberCount column increases the CoD to 0.810695
- Removing the IsREorFW column increases the CoD to 0.801447 (perhaps because people forward and reply to these emails)
- Removing the HasCC column reduces the CoD to 0.786818
- Removing the MayContainATime column reduces the CoD to 0.779756
So after a few tweaks adding and removing columns I ended up trying just the following columns (trying to remove the noise):
- TestFolder
- ReceivedHour
- HasAttachments
- SentDirect
- SenderDomain
- SubjectWordCount
- SpecialCharacterCount
- MayContainATime
- HasCC
This resulted in a CoD of 0.800789
Now that’s getting closer to 1, it’s a good point to look at how to use that trained model for prediction via a published web service.
How to use our trained model for prediction via a published web service
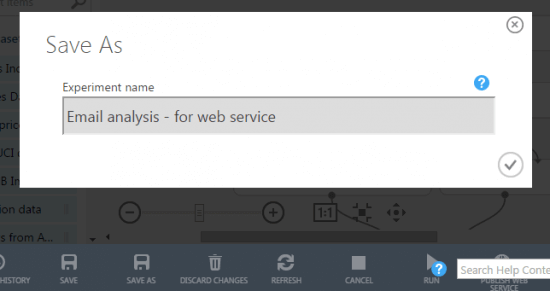
Step 1 – Save a copy of the email analysis project so we can make some changes for publishing a web service
Step 2 – Set the publish input and publish output
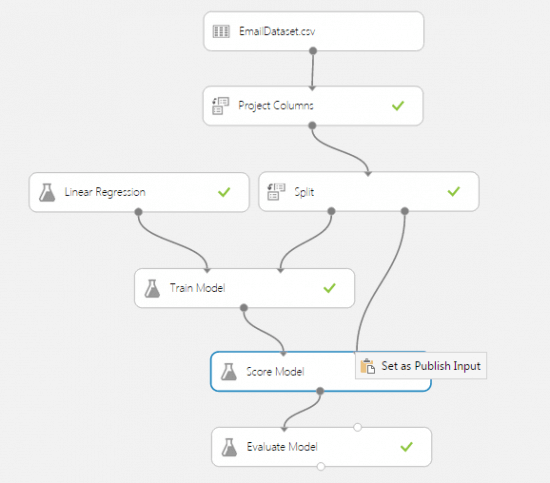
We need to configure the web service to define the inputs to the web service and output results.
Set the Publish input on the Score Model module:
Set the Publish output on the Score Model module:

Set the Publish output on the Score Model module:
Once published you’ll see the dashboard for your web service:
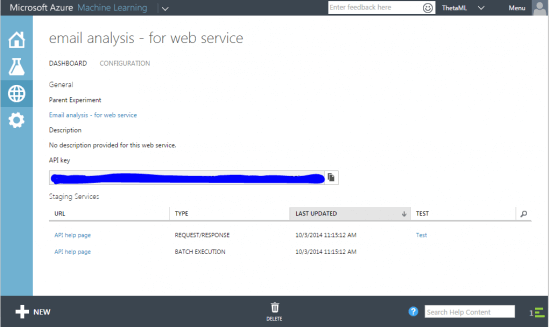
The dashboard contains API help pages for web service requests and batch execution. There is also a helpful test link to try out the web service:

Test results are displayed in the notification area:

The API help page contains sample code to get you up and running:

Using the sample code and API key I wrote a simple app to iterate through a small set of data (past 2 days emails in inbox and whereabouts folders) and output the score.
The app is included in the email analysis app located on GitHub (you will need to specify your own api key and base url).
Here is a sample of the anonymised output:
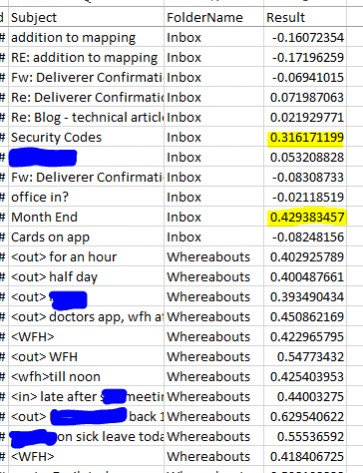
You can see that on the whole that the results here are what we expect – whereabouts emails range in certainty from 0.4 to 0.6 while most emails in the inbox score less than 0.1 with a couple of possible exceptions (highlighted).
For now I’ll be sticking with my email rule as it works pretty well but this is a fairly trivial example. There are lots of other potential applications for this technology.
Some thoughts on this experiment and the wider relevance of machine learning.
How could we improve this example?
Are there other metrics that could have a significant impact?
- Have I replied to or emails this person before?
- Does the email contain my name?
- Does the email contain a salutation – formal or informal?
- What is the country of the senders email domain?
- Sentiment analysis – can we use a service or library to get a score on the positivity of an email?
- Does the email contain a specific brand name or product name?
- Similarity score – rate each email subject on similarity to existing email subjects in particular folders – for example could we predict that an email will get put into a particular folder because previous emails had a project name in the subject?
Is the quality of the data good enough? – I had expected the length of the body text to be significant but the test for word count is crude in that it does not strip html, signature and footer and previous conversation text from the count.
Application / uses
- You could create a smart outlook plugin to automatically flag particular emails for attention, move items to particular folders – e.g. train your inbox based on previous behaviour.
- You could create an application to monitor an email address / inbox / twitter account and forward or flag up particular categories of email / posts etc.
What other tests could we perform?
- Can we predict how likely it is an email would end up in the deleted folder?
- Can we run the experiment again on other folders to see how easy they are to predict – this might be trickier as they tend to relate to specific topics.
What other experiments could we devise?
- Could you predict the likelihood of a person making a travel insurance claim based on gender, age, time of travel, destination etc?
- Could you predict the likelihood of a win on a horse race based on track surface conditions, age, weather, time of year?
- Could you predict how likely a customer is to respond to a special offer, what is the likely change that they will spend more?
- Any large set of historical data with useful metrics could be a potential source of useful experiment data.
With this new offering the entry barrier to adopting and using machine learning in business apps has lowered significantly. Machine learning sits at the intersection of software and BI. I’ll certainly be looking for new opportunities to utilise this capability within Theta making use of our strong in house BI and software team’s skills.


.jpg)

.png)


