


.jpg)

%20(2).png)
%20(1).png)
%20(1).png)


.png)
September 21, 2016
Creating smart reports and applications with machine learning and R
The main users of machine learning and statistics modelling are data scientists. But other users, such as software developers, BI developers, and even business users through self-service BI, can benefit from machine learning and R in their projects. By connecting these tools, they can bring statistics, descriptive, predictive and prescriptive analysis into applications and ultimately develop smarter products and services. In this post, I will show how Microsoft makes it easy for different users to connect and use machine learning and statistics in their reports and applications.
Data scientists

Data scientists already know how to write R and Python code, and have a good understanding of mathematics, statistics and machine learning concepts. But they may not know how to plug their models directly into apps. How they can create a mobile app for their prediction algorithms? How can they show the outputs of their analysis in a user-friendly report? Microsoft facilitates these integrations via Azure ML and Power BI.
From R Studio to Azure ML: quick tutorial

Azure Machine Learning is an end to end solution that facilitates descriptive, predictive and prescriptive analysis. Working with Azure ML helps data scientists easily publish their code as a web service, to be accessible from different platforms.
Data scientists can publish their R code directly from R Studio into Azure ML and create a web service that can be called from any other application.
Imagine that we have a simple function in R Studio for calculating the sum of two variables.

We are going to create an API (web service) for this function that can be called from other platforms (eg mobile applications, web applications). This function gets X and Y as the input, and the sum of these two variables will be returned as the output.
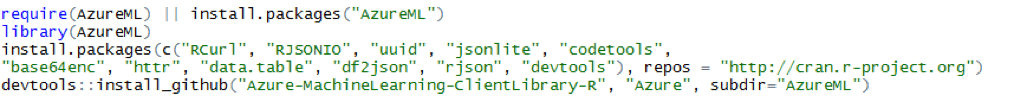
First we need to call some existing Azure ML libraries such as “Azure ML”, and “RCurl” in R studio. These libraries help us to connect to Azure ML environment. See the code below:
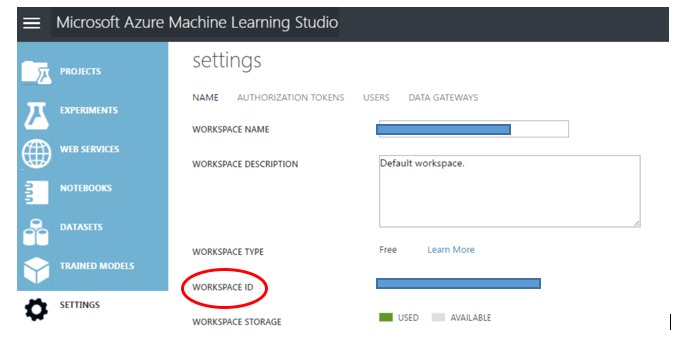
We also need the Workspace ID in Azure ML to create a web service. In Azure ML Studio this can be found in "Settings":
To create a web service in R Studio we need another parameter: “Primary Authorization Token”. We also find this in “Settings” in Azure ML Studio:
.png)
We then use these two parameters in R studio.

The function named “PublishWebService” in R Studio creates a web service of the summation function in Azure ML studio.

This function gets the name of the function in R studio as the first argument. The second argument is the name of web service that we want to show in Azure ML studio. The third is the inputs of the function; the fourth argument is the data type of the function’s output. And the workspace id and authentication token will be passed.
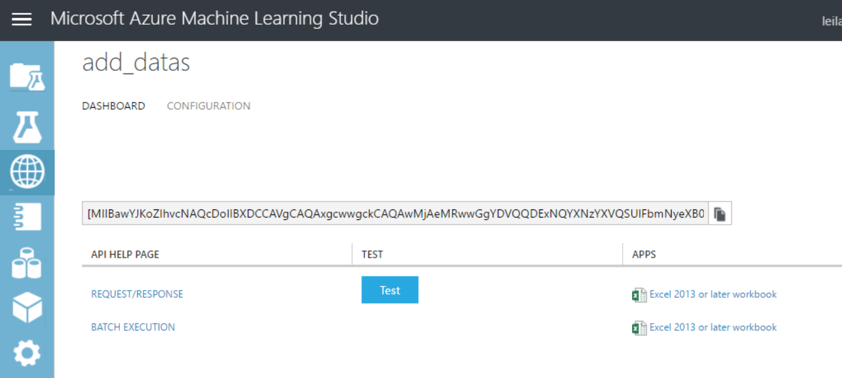
By running this code, a web service with the name “add_datas” will be created in Azure ML Studio in the list of web services. The created web service can then be used by other applications eg mobile, web.
Writing R code in Power BI: quick tutorial
Power BI is Microsoft’s suite of tools to analyse data and share insights. It is one the best tools to visualise and create an interactive report from data. It also lets you bring in data from different sources and do the extract, transform and load (ETL) process easily there. Data scientists can bring their R code into Power BI. They can benefit from the interactive visualisation available in Power BI environments to better show the results of descriptive, predictive and prescriptive analyses.
R programmers can publish their code in Power BI and see the result of their analysis there. Data is more accessible than in R Studio, and Power BI’s interactive reports capability makes the reports easier to digest.
In Power BI, click the Get data menu and in the more option you will find "R Scripts":

.png)
You can also create an interactive report based on the R graphs in Power BI. Microsoft Desktop Power BI helps R programmers to show their own R graphs there.
For instance, to help understand and predict academic performance, you can create a correlation diagram to find the correlation between the “Final Marks” of students and the number of “Failures in Past” according to the different ages of students. In Power BI this report can be more interactive, as the user is able to choose different ages and see how the final marks and past failures will be correlated, by age.
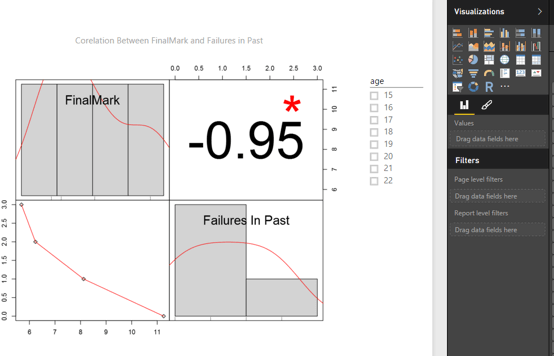
Using R graphs, statistics, and machine learning algorithms in Power BI can reveal more insights about data. It also helps users analyse what will happen if the other parameters change (eg in this example changing the age will impact on the correlation results).
Software developers

Software developers are experts in programming, but using prediction and statistics can help them to build more creative applications.
Software developers can create web services and use the results of web services easily in their code. For instance, at Theta our digital development team used a sentiment analysis API created in Azure ML to extract the keywords in a text, for building a Facebook Messenger bot.
Use Azure ML prediction results in C# code
Predictive analysis can make software smarter. Creating a web service in Azure ML Studio provides a facility for other developers to use the available API in their codes.
Example: calculating probability of insurance purchase
An insurance company’s website shows information about different policies. They want to have a new internal website that shows information about previous and current customers to their sales staff. Each salesperson wants to know the probability that a customer with specific profile will purchase their insurance policies. We created a prediction model to calculate that probability. The output of this prediction can be embedded in a website.
The model was first created in Azure ML Studio. The customer data was imported into the Azure ML environment. We cleaned the data to create a better model. The Two-Class Boosted Decision Tree algorithm was used to make the prediction. (See also the related series of posts on how to train and create a model for prediction).

insurance predictive model in Azure ML
After creating the model in Azure ML, we need to create a web service that makes it accessible for other applications. There are many ways to create a web service from an Azure ML experiment. One way is to run the experiment first and right click on “Train model box” and save the train model as “Trained model”.

Creating a Web service for Predicting the Insurance Buyer Probability
Next, by clicking on deploy web service, the web service will be created automatically. After deploying the web service, the Azure ML API will be shown in separate window. The API Key is available for use in other applications. And by clicking on response/request link, more detailed information about the created web service will be shown to the user.
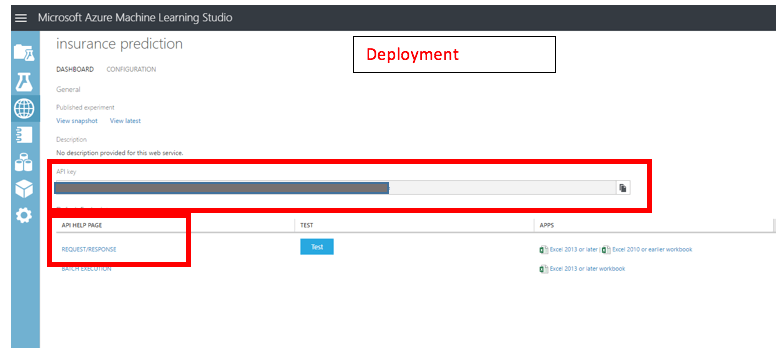
The Insurance Buyer Prediction API in Azure Studio
For instance, in the Request/Response page the API code for using the insurance prediction experiment in C#, R and Python applications are shown.
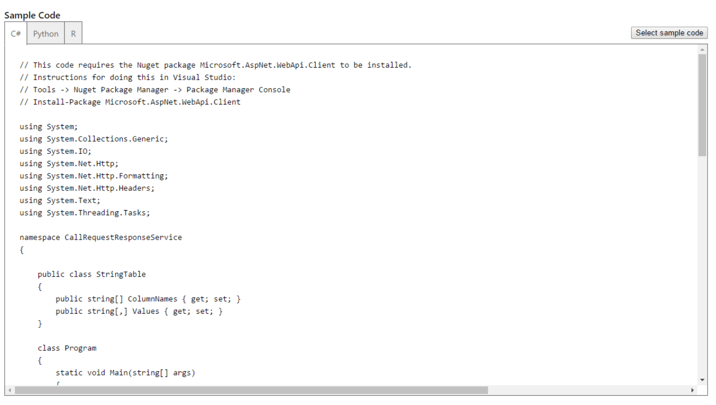
The Request/Response Code for Insurance Buyer Preditcion in C#, Python, and R
Now, when insurance salespeople are looking at the details of prospective customers, they can see purchase probability information, updated in real time as new details are added, all from within their web application. Adding predictive analysis helps deliver better insights about their customers.
Business intelligence developers

People who work with data, such as business intelligence developers and business users, have access to data and know how to extract, transform, and load it. They can, however, benefit from machine learning and statistics concepts to make their reports more informative. Current reports may be focused on what happened in past based on the available data. By using predictive analysis, BI users can create reports that not only describe what happened, but also what is going to happen in the future.
Additionally, statistical modelling can reveal more data insights, such as correlations – for example, sales of a specific product in relation to number of branches in a city.
R integration with SQL Server 2016
Using R in SQL Server allows BI developers to embed predictive analysis code in SQL Server 2016 data. Because that data is high quality and easily accessible, the process of applying analytics is much more accurate and faster.
Example: reseller sales
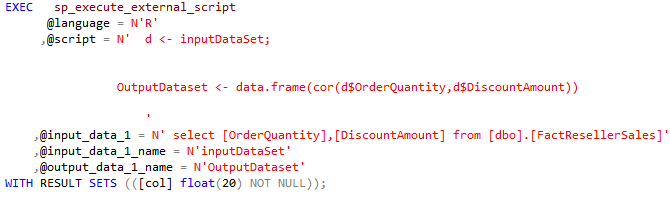
Imagine that we have a data set about reseller sales in SQL Server 2016. As well as the ordinary reports we want to see the correlation between the order quantity and the discount amount on each order. We want to see if there is any correlation between the discount applied on each order and quantity ordered. It is possible to solve this by writing a lot of SQL Code. But to make life simpler, it’s now possible to do the correlation calculation by embedding one simple R code “Cor(a,b)” in SQL scripts.
In SQL Server Management Studio, a stored procedure called “EXEC sp_execute_external_script” has three main parameters. First, the @language gets the name of programming language, which here is R. The second is @script that will hold the R scripts. The input/output for R code can be stored in the @input_data_1_name/@output_data_1_name parameter. As can be seen in the code below, the input for R has been stored in “@input_data_1”. This input is a select statement that gets the order quantity and discount amount from FactResellersSales table. The R code is stored in “@scripts”. This code gets the order quantity and discount amount in “d” variable and then puts the correlation output in the output dataset.
The result of this code can be stored in a separate table that can be used in other applications such as SQL Server Reporting Services (SSRS). To do that we created a table with name "cor" (see code below). The correlation of the order quantity and discount amount can be stored there.
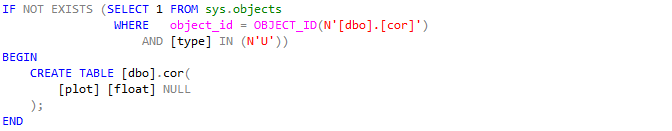
Then the result of the R code can be stored in database using the insert command:
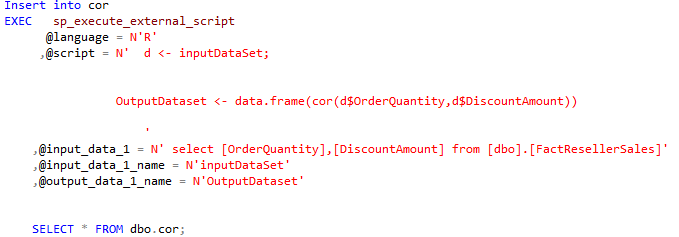
By using the “SELECT * FROM dbo.cor;” the correlation result will be shown to users.
Other R statistics calculations and machine learning algorithms can be embedded in SQL scripts as well, to help developers easily create robust reports and systems.
In conclusion...
Recent Microsoft integrations now make it even easier for data scientists to share and publish their algorithms and so they can be used by a wider audience. At the same time, it’s now easier for developers to incorporate predictive and prescriptive analytics for more intelligent applications. Add accessible data correlations to the mix, and the stage is set for much wider uptake of machine learning, for the development of smarter products, services and applications.