


.jpg)

.png)
%20(1).png)
%20(700%20%C3%97%20500%20px)%20(2).png)


.jpg)
October 18, 2017
IoT SensorTag to Power BI via Streaming Analytics
One of our core innovation lab activities is researching, learning, testing and developing new products with new technologies. By playing with the latest tech, we get a sense of how it might be applied and used. Here's a recent experiment with IoT sensors, by Jim Taylor, Theta's Emerging Technologies Architect.
Internet of Things and analytics
We’ve been considering the possibilities that open up when the physical world is digitised - via internet of things (IoT) sensors – and connected to analytics. What new insights can be gleaned via the real time data we have access to via the sensors? How can we optimise process, resource consumption, decision making and response?
We got our hands on a Texas Instruments SimpleLink Wi-Fi SensorTag Development Kit to take a closer look at what might be possible.
Introducing the SimpleLink Wi-Fi SensorTag Development Kit
The SensorTag uses a low-power wireless microcontroller unit with built-in Wi-Fi connectivity. This allows the SensorTag kit to be battery powered from AAA batteries. It's a handy device that’s easily portable and has a wide range of sensors to experiment with, including:
- Temperature
- Humidity
- Pressure
- Gyroscope
- Acceleration
- Optical light sensor
- Magnetometer
The user guide contains all the info you need to setup and configure the SensorTag and there’s a SensorTag mobile app app for Android and iOS to help with the process.
Once you’ve got the SensorTag IP address from the app you can retrieve data by using the calling the /param_sensortag_poll.html URL.
The plan
I've been keen to try out Azure Streaming Analytics and I have put together a demo app to read data from the sensor to push to a live dashboard in Power BI.
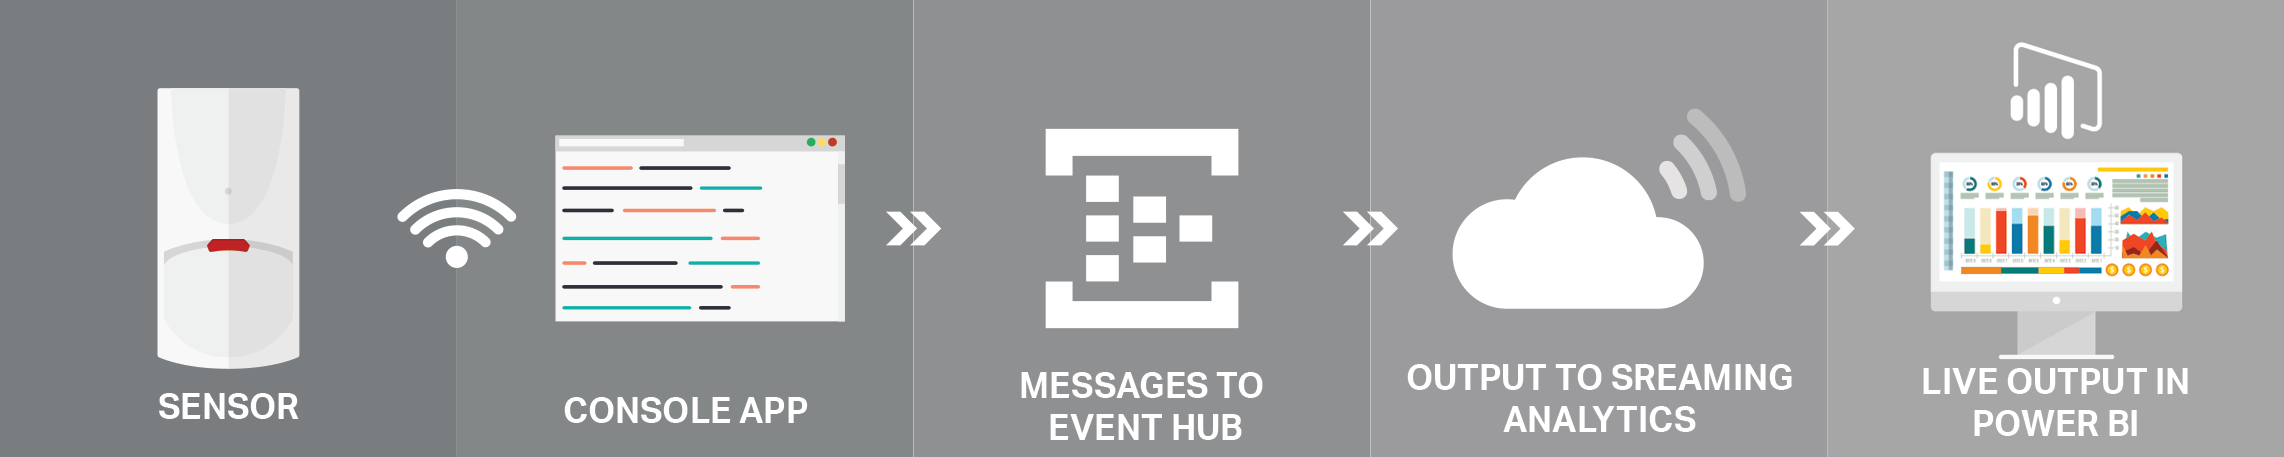
Before we start here’s a visual overview of what we’re going to build:
Building the demo (and a couple of gotchas along the way)
The code for the demo is located here.
First we’ll need to capture the sensor readings from the /param_sensortag_poll.html URL. This returns the data in html format so we’ll have to do some parsing to extract the values.
Handily for us the html is xml compatible, so we can load the document into an XDocument and select the sensor readings using XPath:
This code is contained in the CC3200SensorTag class.
The raw readings are not usable out of the box, as they contain multiple space separated values. To turn these into usable values we pass the dictionary of raw values to the constructor of the SensorReadings class. This class splits the raw values into string arrays, extracts the relevant values and converts to the appropriate data type for each sensor:
The main console app runs a continuous while loop polling the sensor at a regular interval:
To send the event data to Azure Event Hubs we are using the Microsoft.Azure.EventHubs NuGet package. I’ve created a SensorTagHubClient class to encapsulate the logic to send the sensor reading to the event hub. It is called from the sensor tag poller class like so:
The code is all in place so let’s look at what is involved in setting up the event hub.
Setting up the event hub
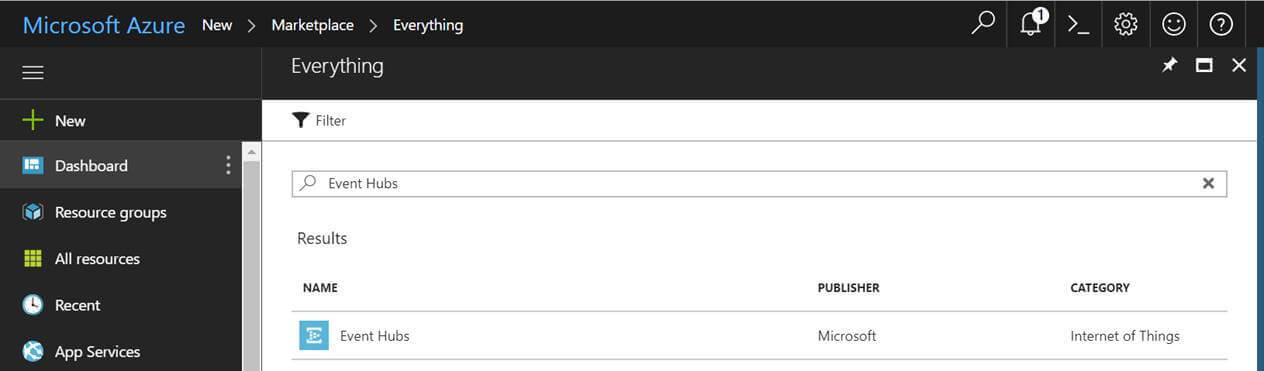
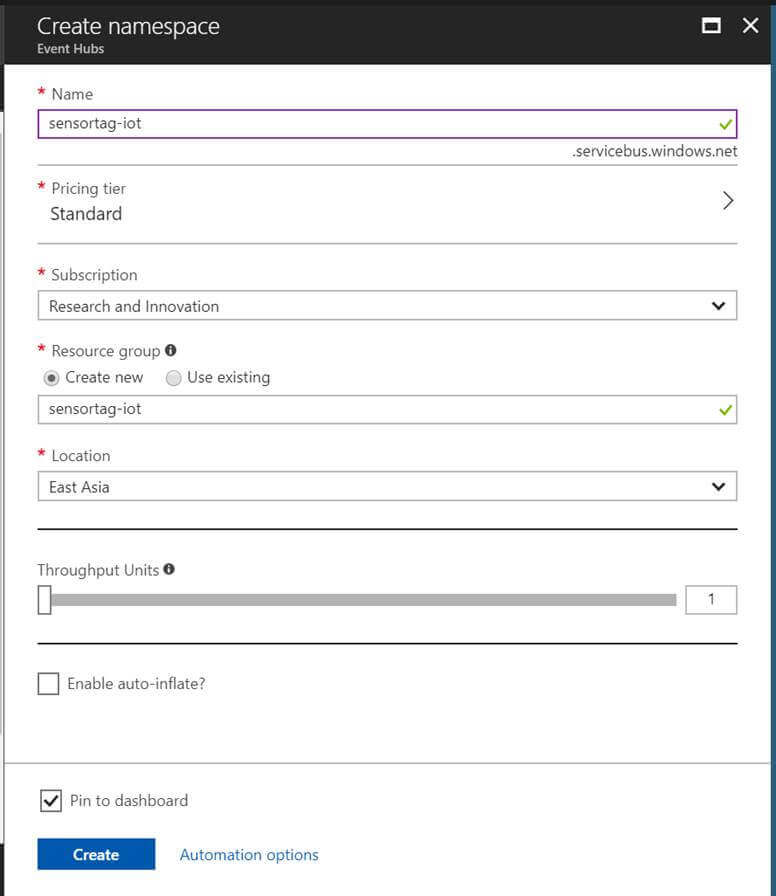
First we create a new event hub namespace on the Azure Portal.
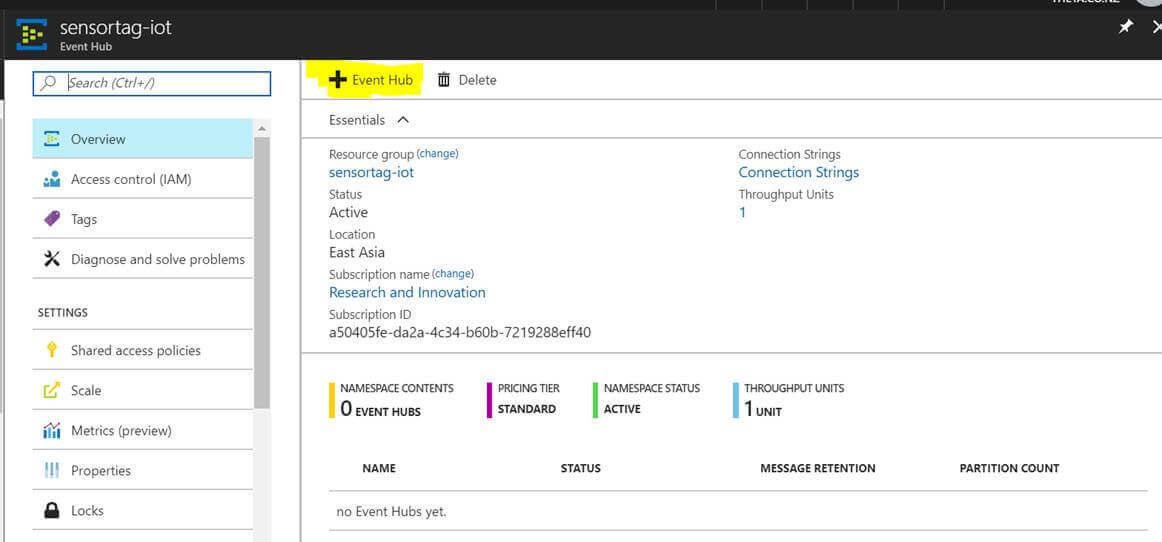
Next we create an event hub.
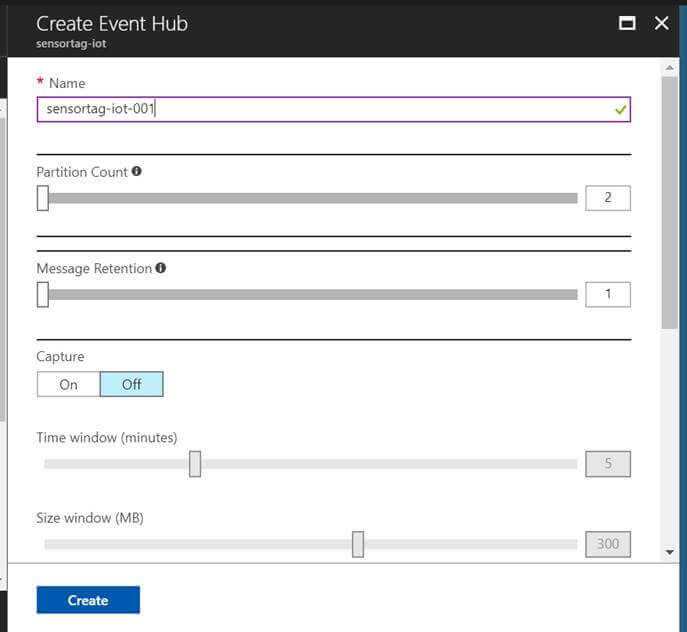
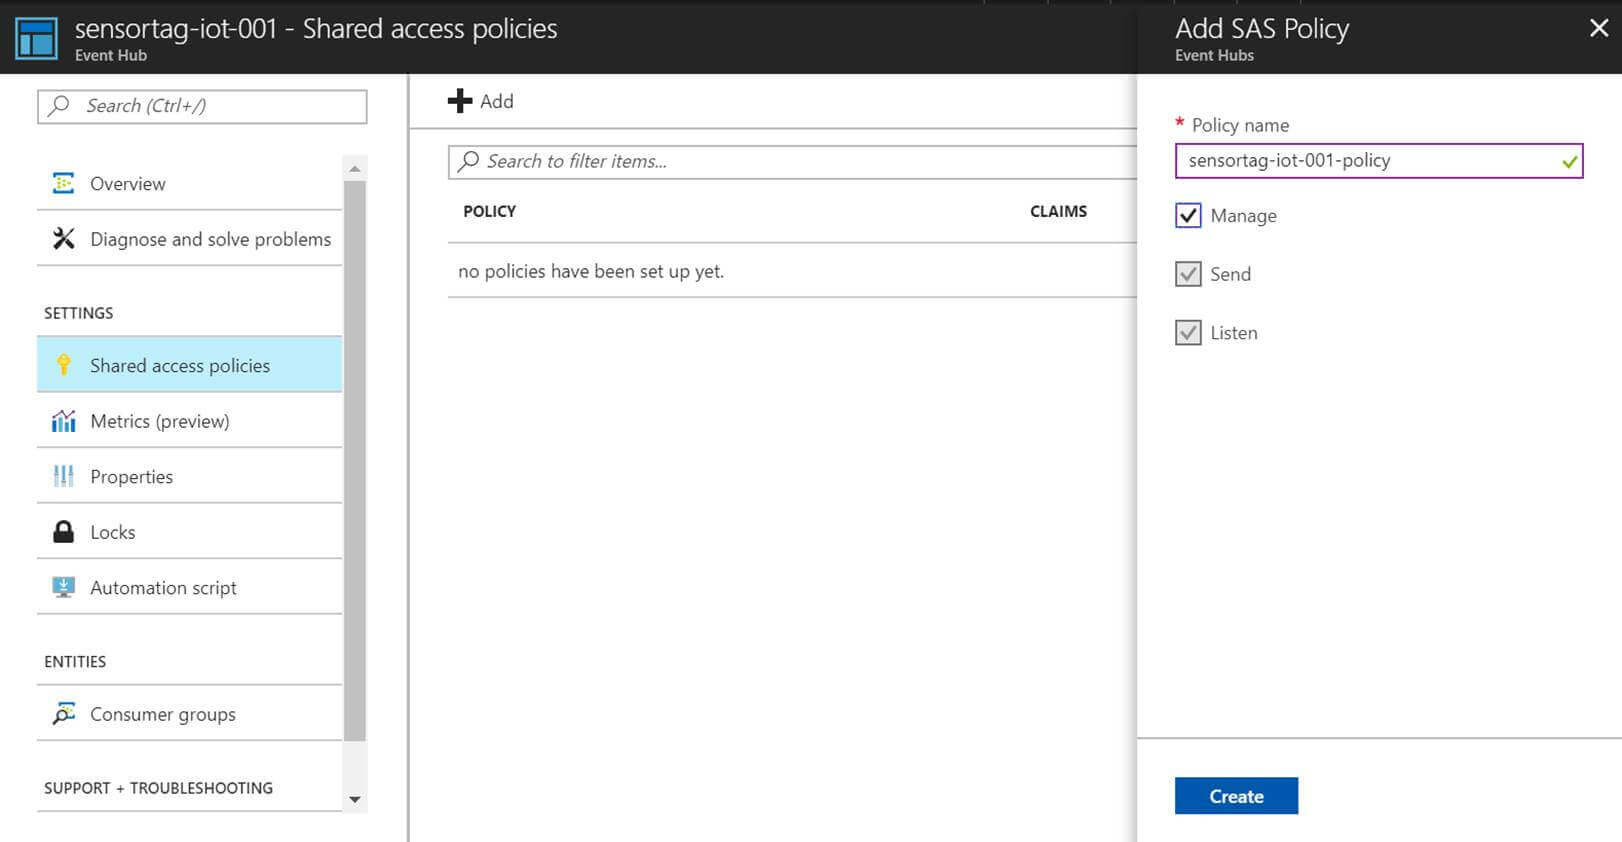
The next step is to set up the shared access policies used to connect to the event hub:
- Select the event hub
- Under settings click the Shared access policies link
- Click Add to create a new policy
Click on the newly created policy and copy the primary connection string.
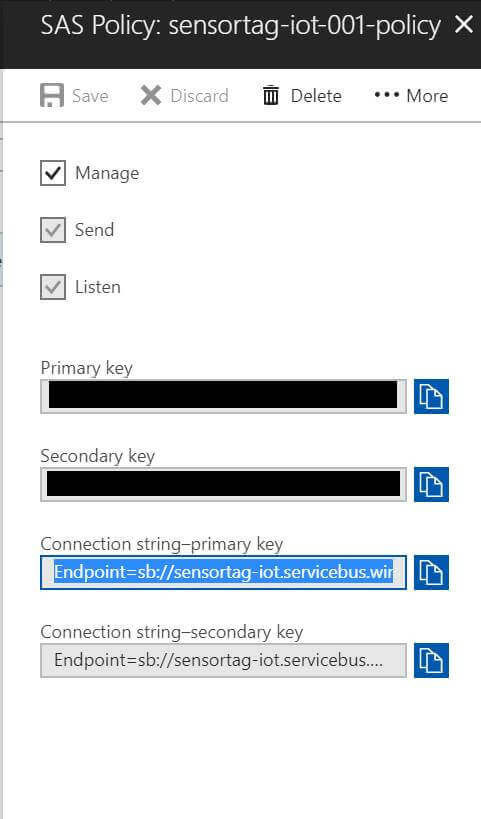
The connection string will look like this:
Endpoint=sb://sensortag-iot.servicebus.windows.net/;SharedAccessKeyName=sensortag-iot-001-policy;SharedAccessKey=YOUR_KEY_HERE;EntityPath=sensortag-iot-001
In the console app you specify the connection string without the EntityPath part and the EntityPath is set as a separate value:
Gotcha #1
Before you start, make sure to open TCP port 5671 when you run into the following exception: “A connection attempt failed because the connected party did not properly respond after a period of time, or established connection failed because connected host has failed to respond”. This TCP port is used for sending and receiving messages to and from the Azure IoT Hub.
More info: http://dotnet-posts.blogspot.co.nz/2016/06/an-introduction-to-azure-iot-hub.html
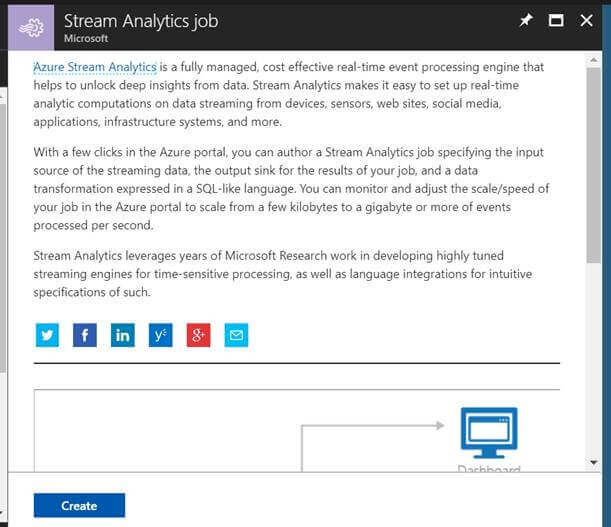
Setting up a streaming analytics job
Now you’ve got your event hub setup it’s time to set up a streaming analytics job.
Create a new streaming analytics job in the Azure Portal.
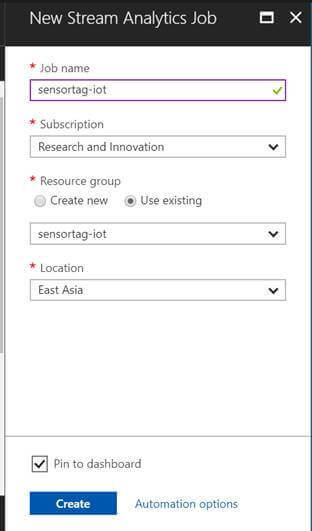
Configuring the input and output
Now the job is created we’ll need to configure the input from the event hub and output to Power BI.
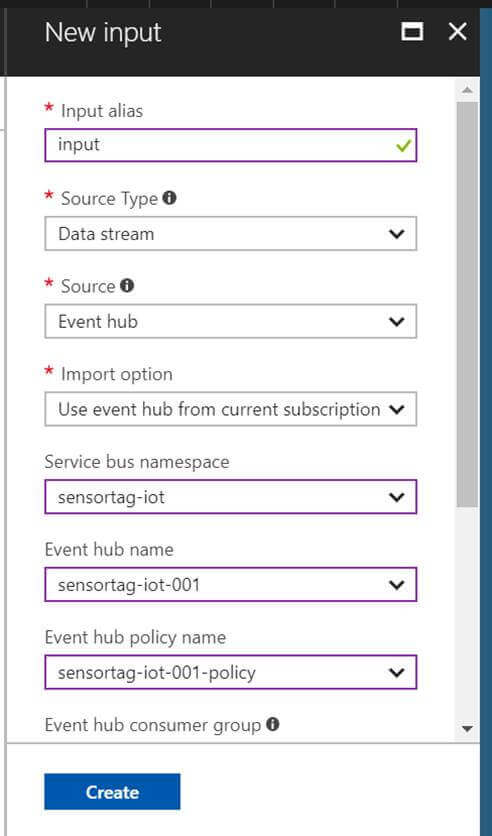
Click on inputs in the Job Topology section to create a new input – by default it has picked up the event hub from the same resource group. In this case we can accept the defaults as it has set JSON event serialization and UTF-8 encoding.
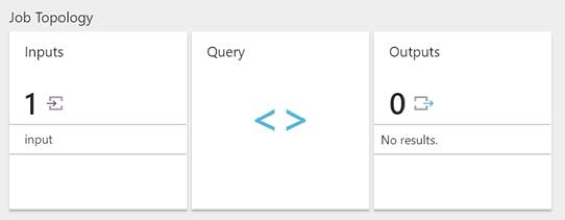
To configure the output for Power BI click the output panel in the Job Topology section.
Select Power BI in the Sink drop down list and click authorize to authorize Power BI to configure output settings
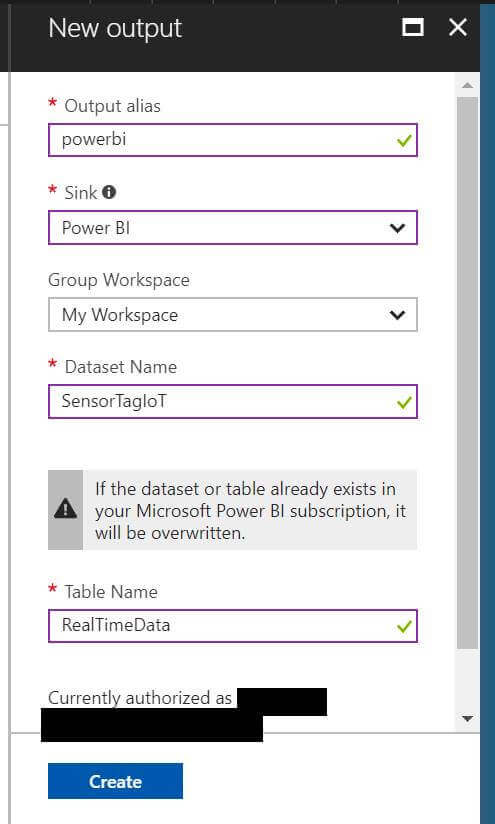
Gotcha #2
Power BI changes the data table name to RealTimeData and creates errors. In this case I’ve simply named the table that to avoid the issue.
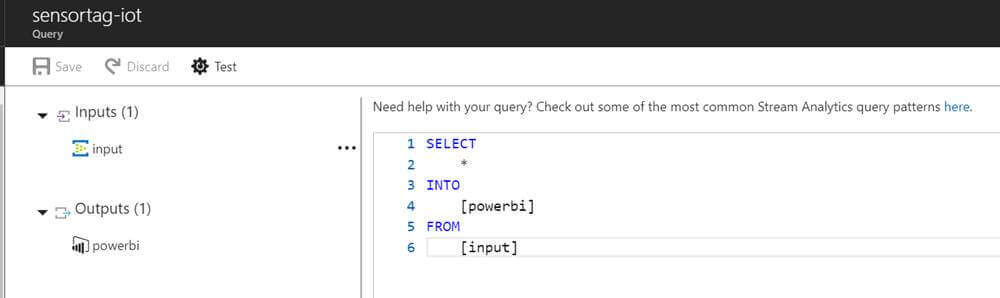
Next we configure the query to copy the source data from the input into the output. Click on the query panel and you’ll see:
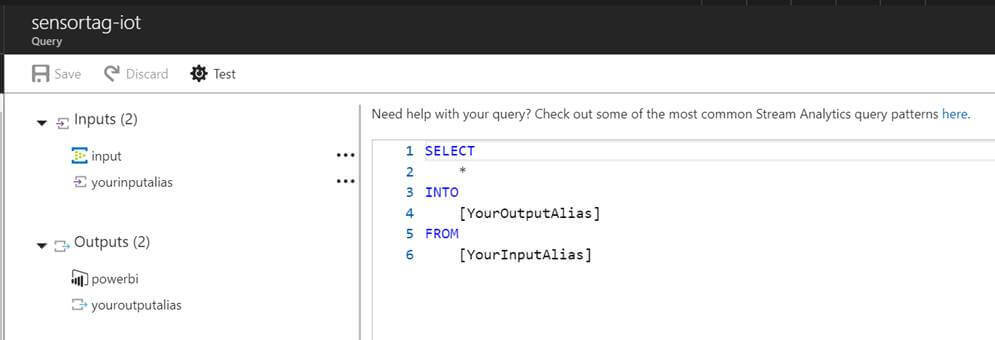
In this case I’m going to copy all the data from input to the Power BI output.
The Stream Analytics query language has some useful constructs that allow you to build complex queries to suit your needs.
Creating a dashboard in Power BI
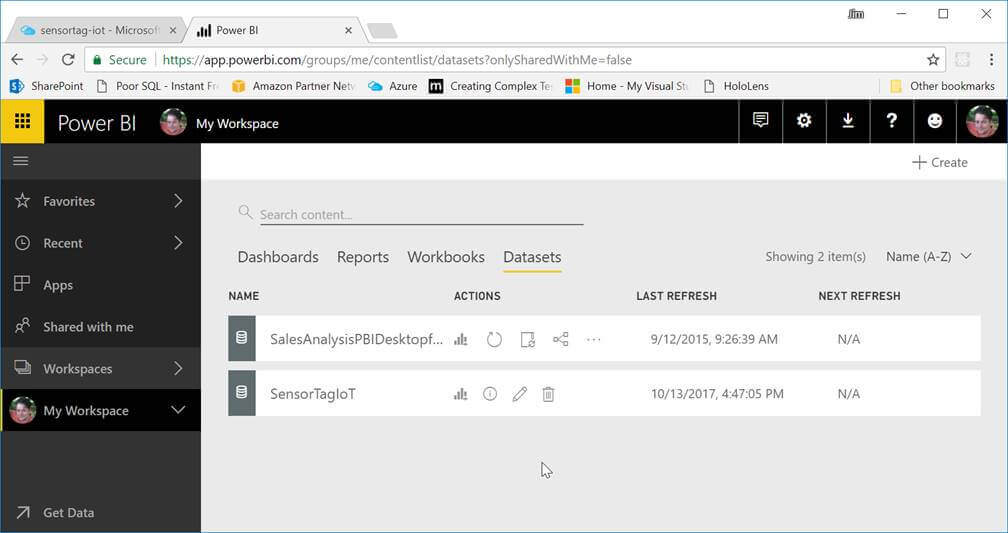
Now we are ready to start the analytics job and create a live dashboard in Power BI.
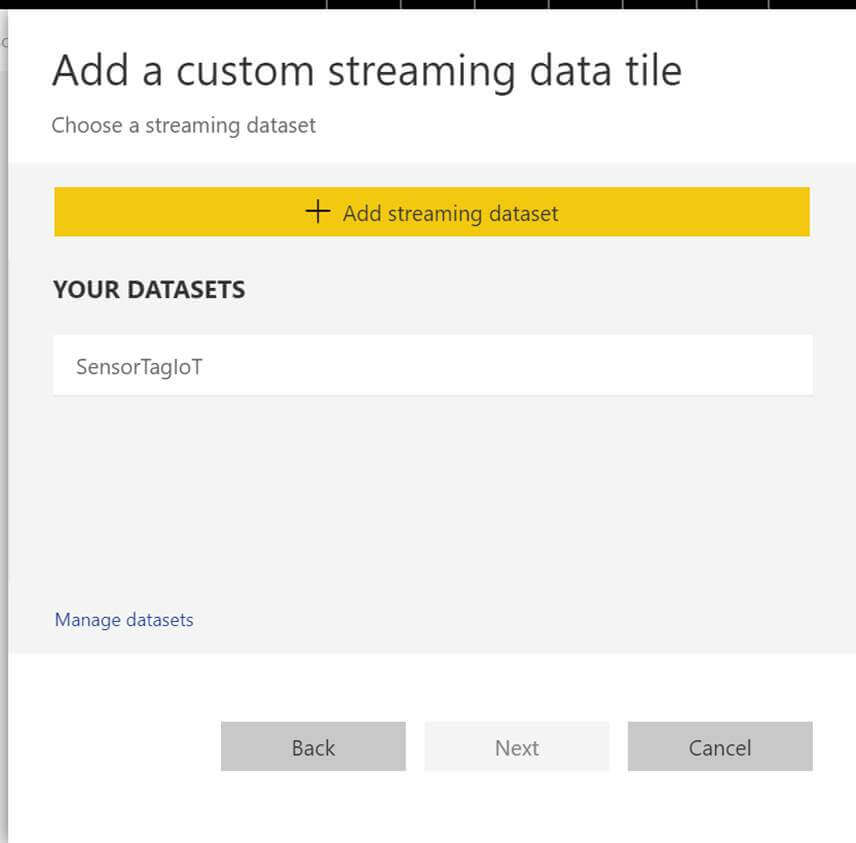
In Power BI you should be able to see your dataset.
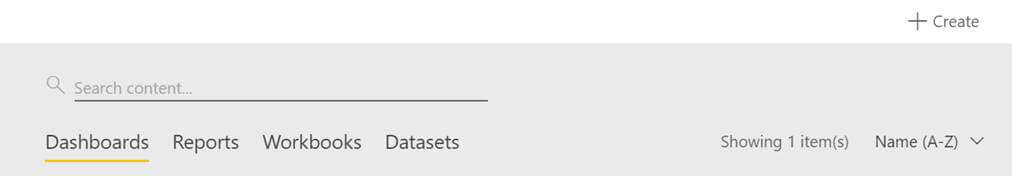
Now go to the dashboard tab and click create.
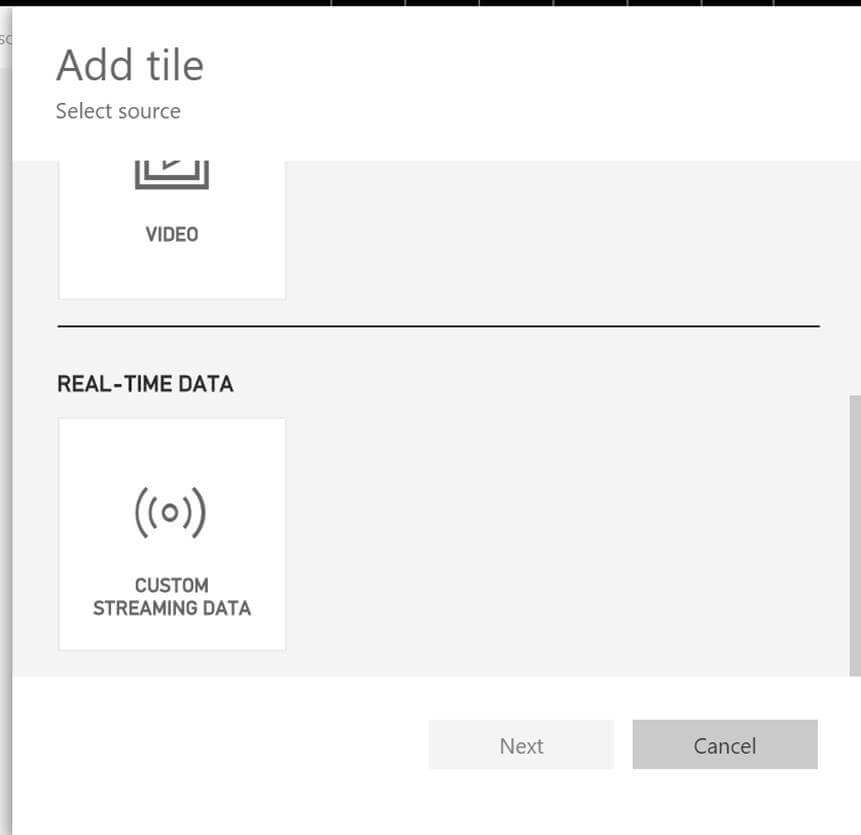
Then click Add Tile > Custom Streaming Data > Add your dataset.
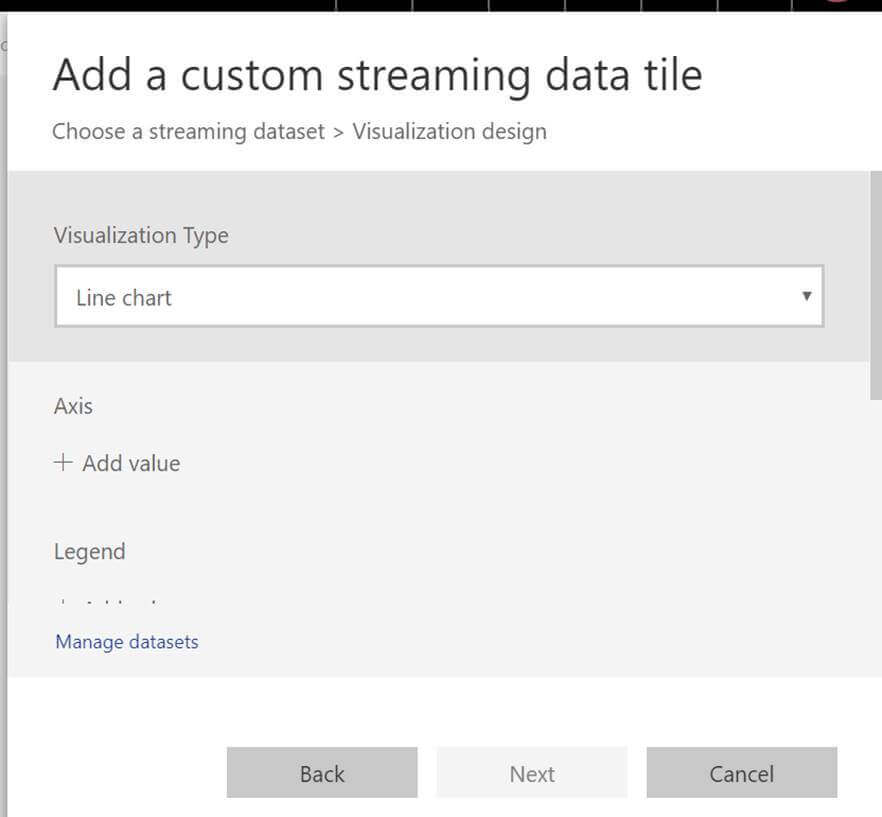
Choose a line chart for your first visualisation:
You can then select values to display by selecting the time axis and adding values to display. Here I have selected the light values in Lux over the last minute.
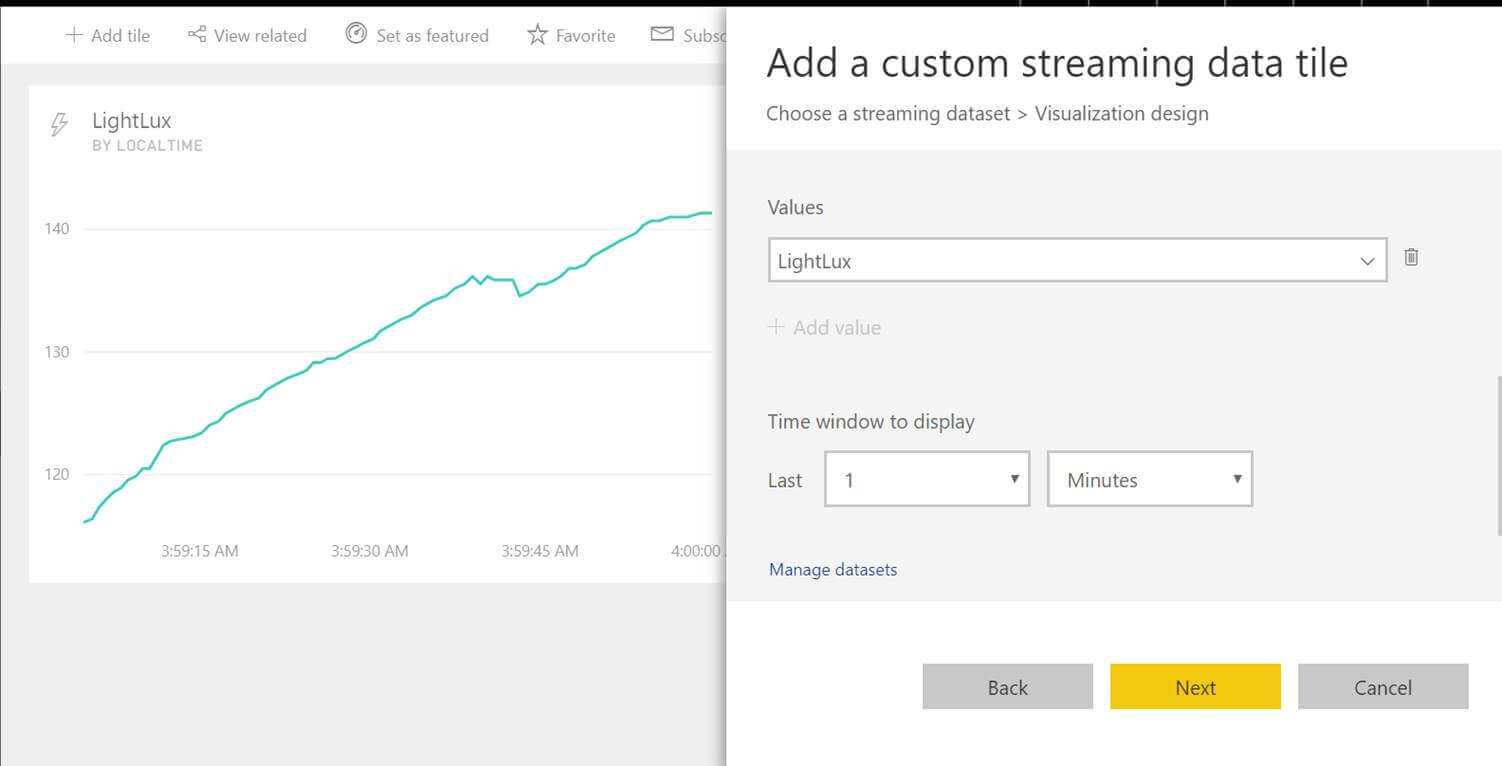
Here I’ve added two tiles – one for light sensor readings and one for ambient temperature.
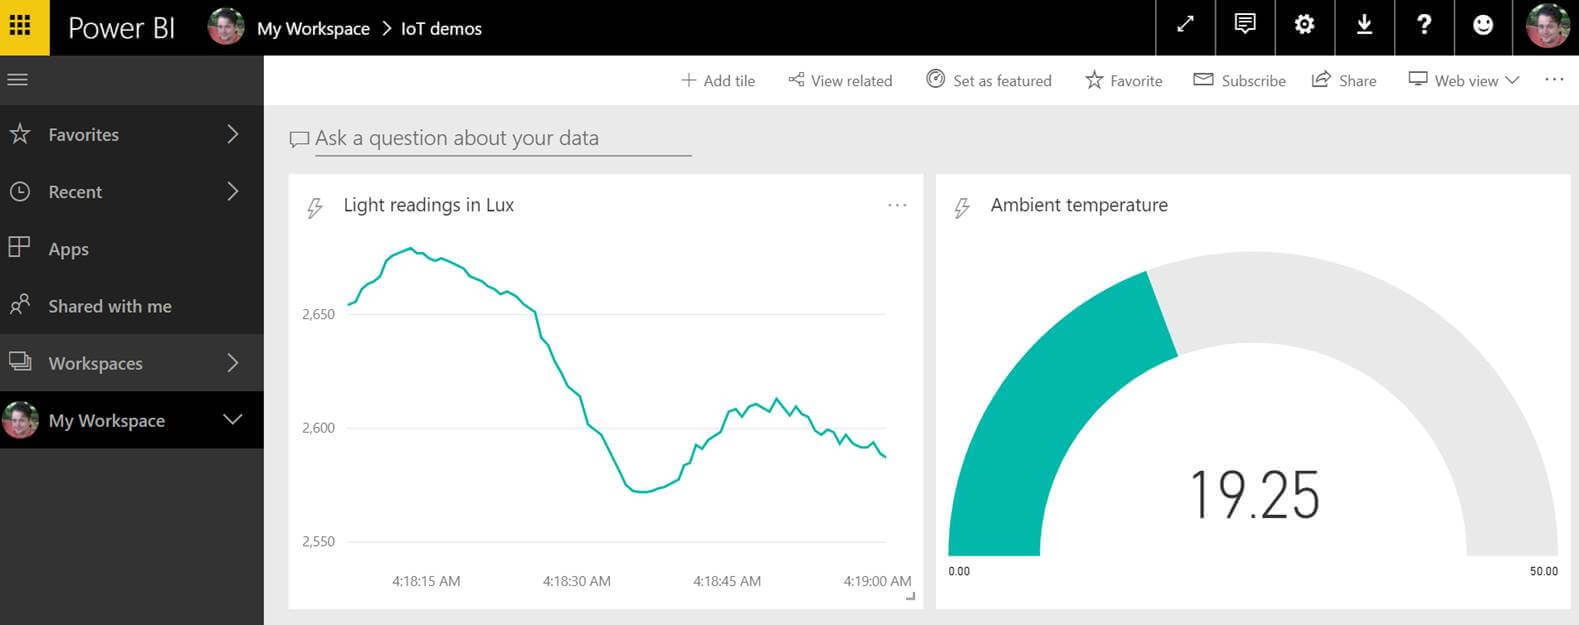
These are now displaying real time sensor readings and we have an end to end process running from source to report.
Potential uses of this technology
In this post I’ve shown how easy it is to set up a simple IoT sensor and connect it to analytics. The SimpleLink Wi-Fi SensorTag is just one kind of IoT sensor - they come in a wide variety of forms and capabilities, and have many benefits and potential applications.
IoT sensors can communicate over different protocols, including Bluetooth Low Energy (BLE), WiFi, Mesh network, SMS using GSM.
Working smartly and remotely
Many IoT sensors are designed to work with low power consumption, so they can be left running in remote or infrequently accessed locations for long periods of time. This means that they can be used for a wide range of monitoring purposes - such as checking on equipment health in remotely located plants, and monitoring of things like lubricant levels and tank levels. This means you always know the state of things in the field, and can save on costly (and sometimes unnecessary) maintenance visits. Other environmental details, such as vibration, temperature, noise and light, can be logged as well, providing additional insights into equipment performance.
In ecology IoT can be put to good use in monitoring habitats. Check out Squawk Squad, an Auckland based social enterprise that crowd-funds sensor-connected traps to protect native birds from predators. The sensors in this use case have the added benefit of providing instant feedback to the citizen funders.
Combining IoT, machine learning and analytics
IoT sensors give you the ability to read and monitor data in real or near real time and this data can be valuable beyond the case of instant visualisation. Data sent to Event Hubs in Azure can be stored for further analysis using machine learning and alerts and warnings can be configured when certain thresholds are met. By combining IoT, analytics and machine learning companies can potentially save money each year by improving efficiency, avoiding costly downtime and reducing costs.