


.jpg)

%20(1).png)
.png)
%20(1).png)


November 10, 2014
How to step inside BizTalk using the Visual Studio debugger
BizTalk is Microsoft’s flagship integration and B2B platform, and is used by many of our clients. Recently I encountered a problem where the ability to step into it with a debugger turned out to be a big help. Some creative thinking is needed to get inside a closed source .NET application, but as I’ll show in this post, a combination of tools - Visual Studio debugger plus the free dotPeek decompiler – did the trick. Even better, this technique is applicable to any situation where you need to debug a compiled application that you don’t have the source code for.
The problem
I had hand-edited a BizTalk map with multiple message inputs and found it wasn’t producing the expected output in BizTalk, although it did when I tested the map in the Visual Studio environment.
When BizTalk executes a map with multiple message inputs it constructs a single XML document containing the messages combined. Unfortunately the method it uses to create this combined document is not published, and it was obviously not using the same method as the Visual Studio IDE. To get my map working, I needed to see how BizTalk was generating the input to the map.
Since BizTalk is implemented as a .NET application, I could (if I knew where to look) use one of the free .NET disassemblers such as ILSpy or dotPeek to reconstruct the source code which executes a map. But BizTalk is a large application with well over 100 assemblies. Finding a single method in all that would be like looking for the proverbial needle in a haystack.
Finding the needle
There is one possible way to narrow down the search, however. When a BizTalk orchestration is compiled, it is converted into C# code. It is possible to attach a debugger to the BizTalk executable and step through the orchestration code. What if I could set a breakpoint at the place where my map is invoked, break into the debugger and step into the BizTalk assembly which will execute the map? Then I would be able to set a watch on the variable containing the map input.
Ordinarily this would not be possible because the debug symbols and source code for BizTalk are not available unless you happen to be a member of the BizTalk developer team. But dotPeek has the ability to act as a symbol server for Visual Studio, which means that it can generate PDF files and source code on the fly for a debugging session. This makes it possible to debug any .NET executable, even without the source code. I decided to give this a try.
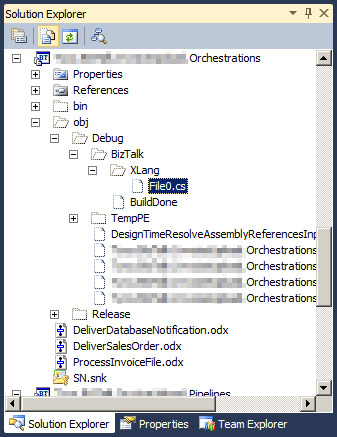
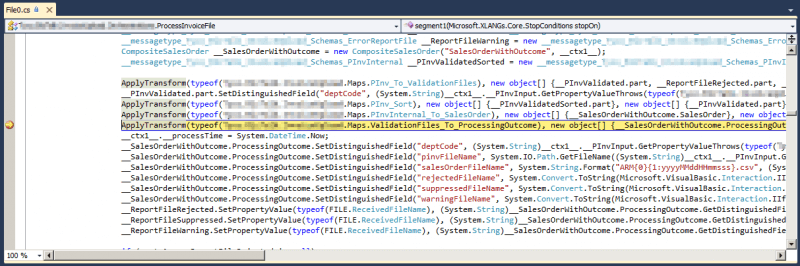
First, I needed to find the code which was calling the map. This was relatively straightforward: when an orchestration is compiled, the C# code is generated in the directory \obj\Debug\BizTalk\XLang, which you can see if you select Show All Files in the Solution Explorer after compiling. Here I found a single C# file named File0.cs. Opening that, I did a text search and found a reference to the map I was interested in on line 1877. Here I saw that it was being called by a method called ApplyTransform in a class called Microsoft.XLANGs.Core.Service, implemented in the assembly Microsoft.XLANGs.Engine.dll.
Now that I know where my map is being called from, I should be able to set a breakpoint in File0, then step into the ApplyTransform method, right? Not so fast. First I need to do some configuration.
Configuring the symbol server
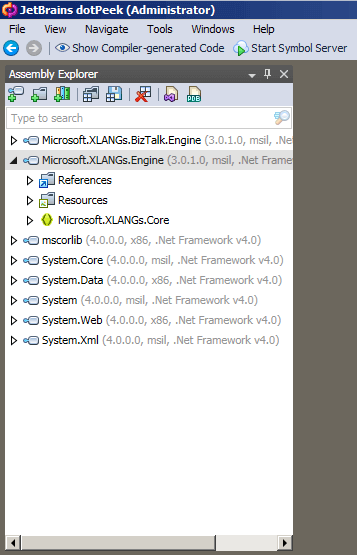
To use dotPeek as a symbol server I need to find and open the Microsoft.XLANGs.Engine.dll assembly. This is straightforward enough, the file can be found at C:\Program Files (x86)\Microsoft BizTalk Server 2010\ along with the other BizTalk assemblies – assuming you have installed BizTalk at the default location.
Next I need to start the symbol server by clicking the toolbar button. Since this is the first time I have done this, dotPeek invites me to select some options:

I have chosen to only generate symbol files for assemblies opened in the Assembly Explorer, since otherwise it may take a long time to decompile all the assemblies loaded by BizTalk.
Next I need to copy the URL for my locally-running symbol server and add it to the list of symbol servers used by Visual Studio. To do this I select Tools > Options, then select Debugging > Symbols:

Clicking the New button at the top right enables me to add the dotPeek url to the list of symbol locations, then I put a check next to it to instruct the Visual Studio IDE to use it while debugging.
Attaching the debugger
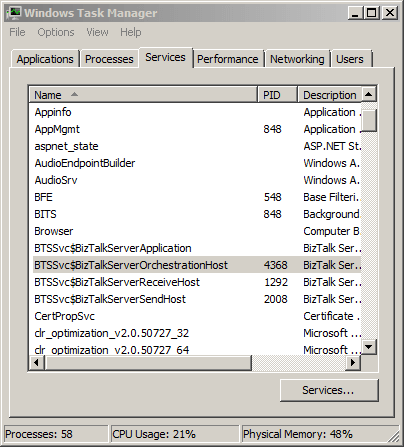
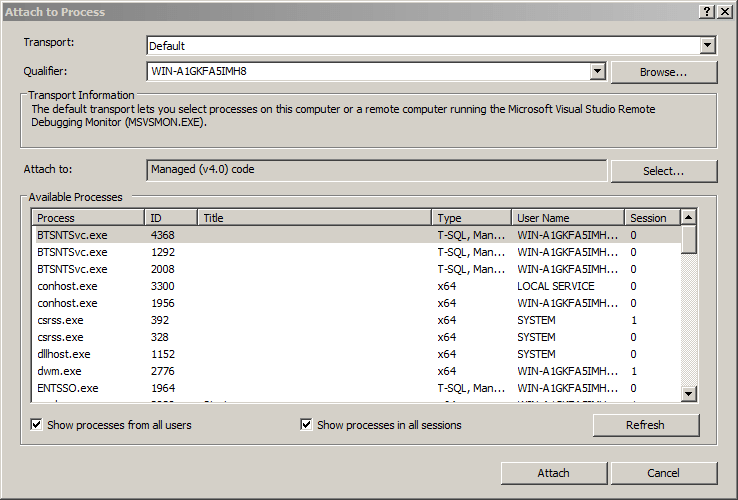
Now I can select Debug > Attach to Process and select one of the instances of BTSNTSvc.exe to debug the BizTalk executable. How do I know which instance to select? Looking at the Services tab in Task Manager will show me the names of each of the BizTalk host instances currently running, and the PID of each one. In this case I know that it will be BTSSvc$BizTalkServerOrchestrationHost because that is the host instance that will be running my orchestration, but this will vary depending on the specific BizTalk host configuration you have set up. I see that the PID of BTSSvc$BizTalkServerOrchestrationHost is 4368, so when attaching I select the BizTalk process with PID 4368:
After attaching to BizTalk and setting a breakpoint at the appropriate location in File0.cs, all I need to do is trigger the orchestration and sure enough the breakpoint is hit:
Not only that, by hitting F11 I am able to step into the ApplyTransform method:
.png)
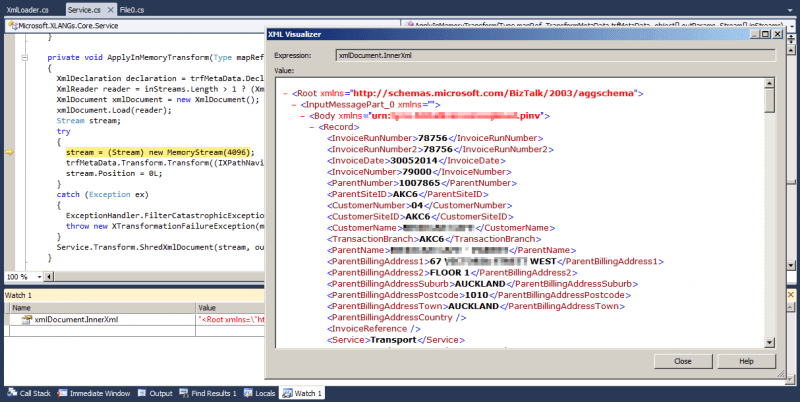
Stepping a short distance further I see that the code calls into ApplyInMemoryTransform, which creates and loads an XmlDocument variable. Now all I need to do is set a watch on xmlDocument.InnerXml and I can see the XML document as BizTalk has constructed it.
So now I have the information I was looking for. Thanks to Jetbrains, the makers of dotPeek, it’s possible to see the internal workings of any .NET application and step through it as it is executing. This is a very useful addition to your developer’s toolkit, and of course it’s not only applicable to BizTalk. It could be invaluable in any situation where you find yourself troubleshooting a closed-source or legacy application.